
How to Design Software — Dynamic Heatmaps (Chloropeths)
Learn how to create a dynamic heatmap of the United States by yourself, without having to buy a license from a company that sells charts.


Learn how to create a dynamic heatmap of the United States by yourself, without having to buy a license from a company that sells charts.
A strangely large number of companies I’ve worked with somehow inevitably get to the point where they want to build or integrate a heatmap of some kind.
In the past, I would reach for the nearest charting library like HighCharts. Why reinvent the wheel, and besides, their charting is cool!
Over time, as I felt the itch to incorporate heatmaps into my weekend projects, I kept bumping it off due to the price. I kept asking myself “is this too expensive for a personal project?”
I don’t know about you, but for me the answer is yes. Some charting libraries charge a licensing fee of $500 per developer. This prices out almost every individual looking to use it for any “for-fun” usage. I lose far too much money buying SPY puts in the stock market to be able to afford spending $500 for a weekend project.
So, like all engineers, I spent half an hour and made it myself.
What is a heatmap?
A heatmap essentially shows a map and colors in various aspects of it based on some sort of scale.
The “map” doesn’t necessarily have to be a map — it can be a periodic table or a bunch of circles. What really matters is that there are distinct areas that will be colored differently depending on what bucket that distinct area falls in to.
As I later learned, these are common called chloropeths.
The components
There’s three aspects of a heatmap as far as web applications are concerned.
the map
the code
the data
The map
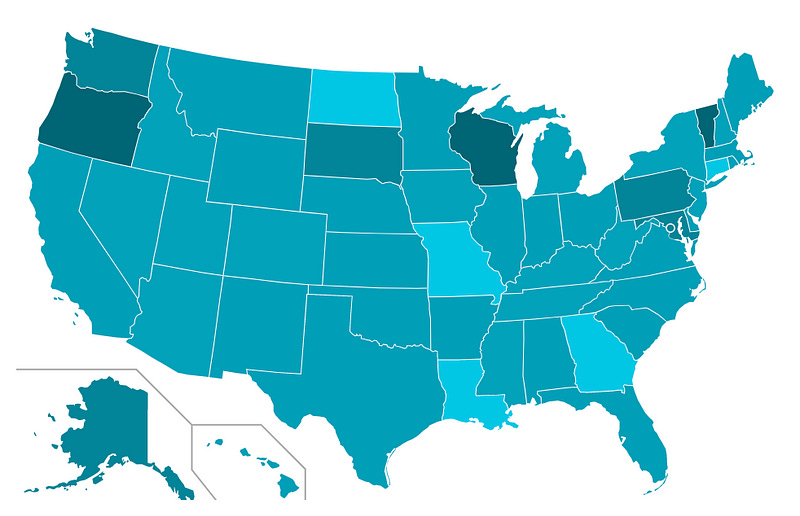
First off, you need an SVG of a map that you can color. I took this one from the Wikimedia Commons:

Breaking down an SVG
If you ever interacted with an SVG file, you may have noticed it behaves differently than other image files. Some sites don’t let you upload them, they maintain their quality when their size changes, and your browser seems to be the default file opener in a lot of cases.
Well, that’s because they are different. SVGs actually consist of markup. If you inspect an SVG file, you’ll see all of the markup that makes up the SVG image.

All of that incomprehensible garbage is actually the data that then makes up the individual lines and shapes. This means that you can do a lot of things like interact with it using Javascript and CSS. It behaves like HTML, so you can add styles, ids, attributes, etc.
That’s where the true power is.
Prepare your SVG
So, let’s assume you found or created your SVG. If you create one, I don’t recommend coding it — use a drawing tool that will output an SVG.
You need to prepare your SVG by adding identifiers to all of the various parts you want to independently color.
The map above was particularly convenient — it was already categorized into states. For others, you may need to do it yourself.
Each of the individual <path> elements that make up a state had an ID attached to it with the ISO 3166 Alpha-2 code.
Hawaii, for example, has an id of HI. If your map is missing it, simply add the id="HI" to the <path> that makes up Hawaii.

The Code
Now, let’s write the coloring function. It’ll be a function that takes an identifier and sets a color. We’ll flesh this out later once we structure the data appropriately — for now let’s stub it out and return a randomly selected color.